


|
Statistical consultancy for business, public services & researchers |
|
AWstatistics |
|
My Statistical Services |

|
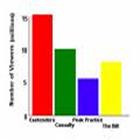
Exploratory Data Analysis Exploratory data analysis can provide a summary of your data using tables, graphs, charts, summary statistics and simple parametric and non parametric tests. It also covers the transformation of variables and their manipulation to create new variables. This may be the only analysis you require or it could be a prelude to model fitting and formal statistical analysis. Exploratory data analysis can suggest relationships between variables to be tested using the more advanced techniques in the sections below. I can produce any type of graph, chart or tabulation using S-Plus, Minitab or Excel software.
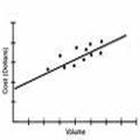
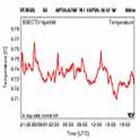
Linear Modelling I fully understand the matrix theory of multiple linear regression and can model your response variable in terms of your proposed explanatory variables and correctly interpret the results. I will check the model assumptions (e.g. independence, homoscedacity and normality) by examination of the residuals from the models. Where these assumptions are violated I may be able to improve the situation by transformations of the data or fitting more complex models which allow for dependence. These include random effects and mixed effects models. For response variables in the form of counts or binary data, I can fit Poisson or logistic regression generalized linear models. In all cases I will investigate outliers and influential observations. Time Series Analysis I can produce simple descriptive plots of time series, smooth them by moving averages and produce linear and polynomial estimates of trend, using splines and regression methods. I can use the classical decomposition method to estimate trend and seasonal or cyclic effects. I can fit autoregressive moving average models (ARMA) to data after suitable differencing to establish stationarity, ARIMA models for non stationary series or SARIMA models to include a seasonal effect. I can test how well a proposed model fits the data and, if the fit is satisfactory, I can use it to make predictions.
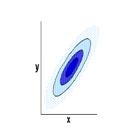
Multivariate Analysis Where several features on the same individual or experimental unit are measured, these variables will, in general, be correlated and special methods of presentation and analysis will be required. I can present multivariate data using matrices of 2 dimensional plots, 3D rotational plots, star plots or Andrews plots. I can also implement dimension reduction techniques such as principal components analysis and factor analysis. Other data analytic techniques I am trained in are: multidimensional scaling, cluster analysis and discriminant analysis. Where multivariate normal distribution can be assumed, I am able to perform one and two sample hypothesis tests and likelihood ratio tests.
Medical Applications I am trained in the analysis of survival data by:
· life table and the Kaplan-Meier methods of estimating the survivor function from data on survival times,
· parametric and semi parametric (proportional hazard models) for comparing survival in two or more treatment groups.
I am familiar with the protocol for the operation of a clinical trials including methods of randomisation, calculation of trial size, dangers of multiplicity of testing and protocol deviations. I know how to combine trials using the proper form of meta analysis. I am able to analyse the results from the common trial designs including: parallel, in series, crossover, factorial and sequential designs.
Design of Experiments & Industrial Applications I can design and analyse the following types of experiment: · Complete randomised designs, · Randomised block and latin square designs, · Incomplete block designs, · Crossover designs, · Complete & fractional factorial designs. I am trained in the following industrial applications: · the production charts for statistical process control of industrial and commercial processes, including cusum and charts for attributes. · the theory and calculation of process capability and 6-sigma methods, · the analysis of product reliability data.
Sampling Schemes I am able to advise on the planning of sample surveys and the design of questionnaires. I can advise on the most appropriate method of sampling (e.g. simple random, stratified, cluster, systematic or quota) and the analysis in each case. I can calculate the correct sample size to ensure that your hypotheses are fully tested or estimates fall within required confidence intervals.
Programming & Computational Statistics Modern computational methods allow us to simulate non standard random variables and to calculate summary statistics such as mean, variance and quantiles. Simulation can also be used to carry out inference using randomisation and bootstrap tests in cases where the distribution of test statistic is not tabulated or cannot be determined by analytic means. These tests are a useful alternative to the usual t-tests or analysis of variance. I use S-Plus to perform the calculations and for general programming. I am also familiar with the theory and practice of the expectation maximisation (EM) algorithm for estimating parameters where the distribution function can be assumed, kernel density estimation, and estimation of parameters in a multivariate distribution using profile likelihood.
Financial Applications Financial audit will generally involve sampling: random, judgemental or a combination of both, from transactions in business records in order to arrive at a judgement on compliance with accountancy standards and statutory regulation. When satisfactory compliance is not achieved and it is not practical to examine all transactions, simple or stratified random sampling may be used to quantify the error within a specified confidence interval. Monetary unit sampling is a method specifically developed for sampling from financial data. From my career in H.M. Revenue & Customs (formerly H.M. Customs & Excise) I have a great deal of experience of sampling from business records, quantifying compliance and estimating values of errors.
Modelling Extreme Climate Events For my M.Sc. Dissertation, “Trends in European Climate Extremes during the 20th Century”, I researched the theory of extreme value distributions and applied this to large data sets (100 years +) of daily temperature and precipitation observations at six European locations and estimated trends in extreme events. My original work in this field was to adapt existing computer programmes to include explanatory covariates and to estimate their effect on extremes. In particular I applied the methods to estimating the “expected time to return” of extreme cumulative precipitation events.
|


|
$ |
|
€ |
|
£ |